The easiest way to see if your disks are causing performance problems is to look at read and write delays on each physical disk. This can be done as follows:
- Start Performance Monitor.
- Navigate to Monitoring Tools, Performance Monitor.
- Click the Add button.
- Navigate to the PhysicalDisk counter group and expand it.
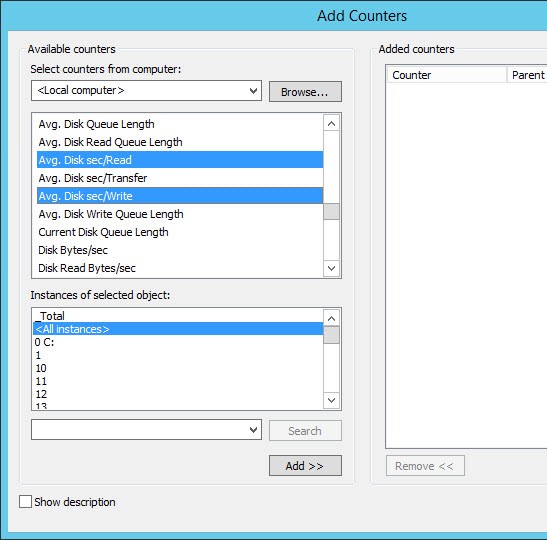
- Add the Avg. Disk sec/Read and Avg. Disk sec/Write counters for the disk instances you’re concerned about, as the following figure shows.
- Click OK.
Look at the values. Anything sustained above .030 (30 milliseconds) is typically a storage performance problem. (For high-performance storage it’s typically 0.000.) Certainly when you start seeing .1, that’s a huge performance impact that will affect all performance.
More in-depth monitoring would look at the below.
Hard Disk Bottleneck
Since the disk system stores and handles programs and data on the server, a bottleneck affecting disk usage and speed will have a big impact on the server’s overall performance.
Please note that if the disk objects have not been enabled on your server, you need to use the command-line tool Diskperf to enable them. Also, note that % Disk Time can exceed 100 percent and, therefore, I prefer to use % Idle Time, Avg. Disk sec/Read, and Avg. Disk sec/write to give me a more accurate picture of how busy the hard disk is. You can find more on % Disk Time in the Knowledge Base article available at support.microsoft.com/kb/310067.
Following are the counters the Microsoft Service Support engineers rely on for disk monitoring.
LogicalDisk\% Free Space This measures the percentage of free space on the selected logical disk drive. Take note if this falls below 15 percent, as you risk running out of free space for the OS to store critical files. One obvious solution here is to add more disk space.
PhysicalDisk\% Idle Time This measures the percentage of time the disk was idle during the sample interval. If this counter falls below 20 percent, the disk system is saturated. You may consider replacing the current disk system with a faster disk system.
PhysicalDisk\Avg. Disk Sec/Read This measures the average time, in seconds, to read data from the disk. If the number is larger than 25 milliseconds (ms), that means the disk system is experiencing latency when reading from the disk. For mission-critical servers hosting SQL Server® and Exchange Server, the acceptable threshold is much lower, approximately 10 ms. The most logical solution here is to replace the current disk system with a faster disk system.
PhysicalDisk\Avg. Disk Sec/Write This measures the average time, in seconds, it takes to write data to the disk. If the number is larger than 25 ms, the disk system experiences latency when writing to the disk. For mission-critical servers hosting SQL Server and Exchange Server, the acceptable threshold is much lower, approximately 10 ms. The likely solution here is to replace the disk system with a faster disk system.
PhysicalDisk\Avg. Disk Queue Length This indicates how many I/O operations are waiting for the hard drive to become available. If the value here is larger than the two times the number of spindles, that means the disk itself may be the bottleneck.
Memory\Cache Bytes This indicates the amount of memory being used for the file system cache. There may be a disk bottleneck if this value is greater than 300MB.
Michael O’Brien